Note
Click here to download the full example code
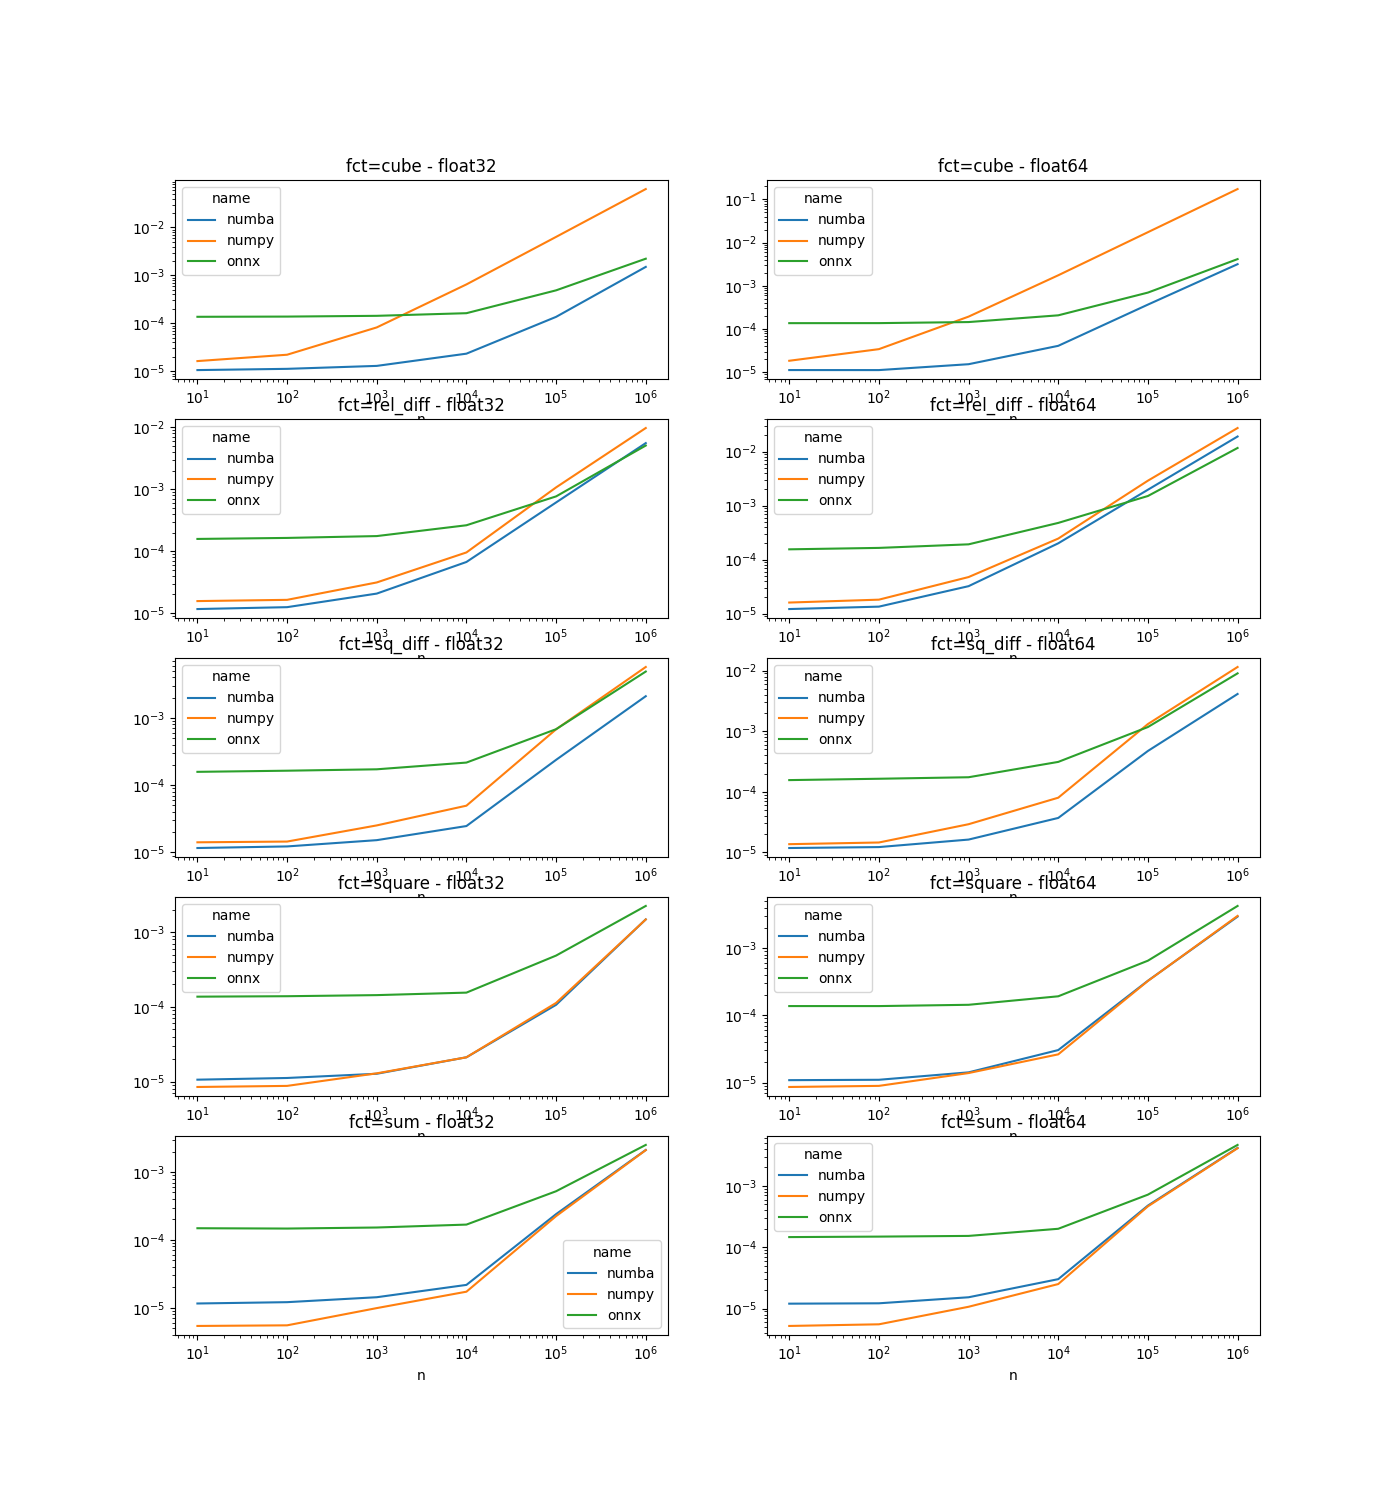
Compares numba, numpy, onnxruntime for simple functions#
The following benchmark is inspired from bench_arrayexprs.py. It compares numba, numpy and onnxruntime for simple functions. As expected, numba is better than the other options.
The functions#
import numpy
import pandas
import matplotlib.pyplot as plt
from numba import jit
from typing import Any
import numpy as np
from tqdm import tqdm
from cpyquickhelper.numbers.speed_measure import measure_time
from mlprodict.npy import NDArray, onnxnumpy_np
from mlprodict.npy.onnx_numpy_annotation import NDArrayType
import mlprodict.npy.numpy_onnx_impl as npnx


# @jit(nopython=True)
def sum(a, b):
    return a + b

# @jit(nopython=True)


def sq_diff(a, b):
    return (a - b) * (a + b)

# @jit(nopython=True)


def rel_diff(a, b):
    return (a - b) / (a + b)

# @jit(nopython=True)


def square(a):
    # Note this is currently slower than `a ** 2 + b`, due to how LLVM
    # seems to lower the power intrinsic.  It's still faster than the naive
    # lowering as `exp(2 * log(a))`, though
    return a ** 2


def cube(a):
    return a ** 3
ONNX version#
The implementation uses the numpy API for ONNX to keep the same code.
@onnxnumpy_np(signature=NDArrayType(("T:all", "T"), dtypes_out=('T',)),
              runtime="onnxruntime")
def onnx_sum_32(a, b):
    return a + b


@onnxnumpy_np(signature=NDArrayType(("T:all", "T"), dtypes_out=('T',)),
              runtime="onnxruntime")
def onnx_sq_diff_32(a, b):
    return (a - b) * (a + b)


@onnxnumpy_np(signature=NDArrayType(("T:all", "T"), dtypes_out=('T',)),
              runtime="onnxruntime")
def onnx_rel_diff_32(a, b):
    return (a - b) / (a + b)


@onnxnumpy_np(signature=NDArrayType(("T:all", ), dtypes_out=('T',)),
              runtime="onnxruntime")
def onnx_square_32(a):
    return a ** 2


@onnxnumpy_np(signature=NDArrayType(("T:all", ), dtypes_out=('T',)),
              runtime="onnxruntime")
def onnx_cube_32(a):
    return a ** 3
numba optimized#
jitter = jit(nopython=True)
nu_sum = jitter(sum)
nu_sq_diff = jitter(sq_diff)
nu_rel_diff = jitter(rel_diff)
nu_square = jitter(square)
nu_cube = jitter(cube)
Benchmark#
obs = []

for n in tqdm([10, 100, 1000, 10000, 100000, 1000000]):
    number = 100 if n < 1000000 else 10
    for dtype in [numpy.float32, numpy.float64]:
        samples = [
            [numpy.random.uniform(1.0, 2.0, size=n).astype(dtype)],
            [numpy.random.uniform(1.0, 2.0, size=n).astype(dtype)
             for i in range(2)]]

        for fct1, fct2, fct3, n_inputs in [
                (sum, nu_sum, onnx_sum_32, 2),
                (sq_diff, nu_sq_diff, onnx_sq_diff_32, 2),
                (rel_diff, nu_rel_diff, onnx_rel_diff_32, 2),
                (square, nu_square, onnx_square_32, 1),
                (cube, nu_cube, onnx_cube_32, 1)]:
            sample = samples[n_inputs - 1]
            if n_inputs == 2:
                fct1(*sample)
                fct1(*sample)
                r = measure_time('fct1(a,b)', number=number, div_by_number=True,
                                 context={'fct1': fct1, 'a': sample[0], 'b': sample[1]})
                r.update(dict(dtype=dtype, name='numpy', n=n, fct=fct1.__name__))
                obs.append(r)

                fct2(*sample)
                fct2(*sample)
                r = measure_time('fct2(a,b)', number=number, div_by_number=True,
                                 context={'fct2': fct2, 'a': sample[0], 'b': sample[1]})
                r.update(dict(dtype=dtype, name='numba', n=n, fct=fct1.__name__))
                obs.append(r)

                fct3(*sample)
                fct3(*sample)
                r = measure_time('fct3(a,b)', number=number, div_by_number=True,
                                 context={'fct3': fct3, 'a': sample[0], 'b': sample[1]})
                r.update(dict(dtype=dtype, name='onnx', n=n, fct=fct1.__name__))
                obs.append(r)
            else:
                fct1(*sample)
                fct1(*sample)
                r = measure_time('fct1(a)', number=number, div_by_number=True,
                                 context={'fct1': fct1, 'a': sample[0]})
                r.update(dict(dtype=dtype, name='numpy', n=n, fct=fct1.__name__))
                obs.append(r)

                fct2(*sample)
                fct2(*sample)
                r = measure_time('fct2(a)', number=number, div_by_number=True,
                                 context={'fct2': fct2, 'a': sample[0]})
                r.update(dict(dtype=dtype, name='numba', n=n, fct=fct1.__name__))
                obs.append(r)

                fct3(*sample)
                fct3(*sample)
                r = measure_time('fct3(a)', number=number, div_by_number=True,
                                 context={'fct3': fct3, 'a': sample[0]})
                r.update(dict(dtype=dtype, name='onnx', n=n, fct=fct1.__name__))
                obs.append(r)

df = pandas.DataFrame(obs)
print(df)
Out:
  0%|          | 0/6 [00:00<?, ?it/s]
 17%|#6        | 1/6 [00:08<00:40,  8.09s/it]
 33%|###3      | 2/6 [00:09<00:17,  4.40s/it]
 50%|#####     | 3/6 [00:12<00:10,  3.42s/it]
 67%|######6   | 4/6 [00:18<00:08,  4.39s/it]
 83%|########3 | 5/6 [01:01<00:18, 18.55s/it]
100%|##########| 6/6 [01:42<00:00, 26.16s/it]
100%|##########| 6/6 [01:42<00:00, 17.10s/it]
      average     deviation  min_exec  ...   name        n      fct
0    0.000005  9.411357e-08  0.000005  ...  numpy       10      sum
1    0.000012  1.614372e-07  0.000011  ...  numba       10      sum
2    0.000148  8.374489e-07  0.000148  ...   onnx       10      sum
3    0.000014  1.436907e-07  0.000014  ...  numpy       10  sq_diff
4    0.000012  1.383735e-07  0.000012  ...  numba       10  sq_diff
..        ...           ...       ...  ...    ...      ...      ...
175  0.002935  3.809907e-05  0.002877  ...  numba  1000000   square
176  0.004226  7.632749e-05  0.004118  ...   onnx  1000000   square
177  0.173547  3.042716e-05  0.173500  ...  numpy  1000000     cube
178  0.003174  4.761741e-06  0.003170  ...  numba  1000000     cube
179  0.004159  1.051921e-04  0.004047  ...   onnx  1000000     cube

[180 rows x 12 columns]
Graphs#
fcts = list(sorted(set(df.fct)))
fig, ax = plt.subplots(len(fcts), 2, figsize=(14, len(fcts) * 3))

for i, fn in enumerate(fcts):
    piv = pandas.pivot(data=df[(df.fct == fn) & (df.dtype == numpy.float32)],
                       index="n", columns="name", values="average")
    piv.plot(title="fct=%s - float32" % fn,
             logx=True, logy=True, ax=ax[i, 0])
    piv = pandas.pivot(data=df[(df.fct == fn) & (df.dtype == numpy.float64)],
                       index="n", columns="name", values="average")
    piv.plot(title="fct=%s - float64" % fn,
             logx=True, logy=True, ax=ax[i, 1])
plt.show()
Total running time of the script: ( 1 minutes 56.999 seconds)