Note
Click here to download the full example code
Profiling of ONNX graph with onnxruntime
This example shows to profile the execution of an ONNX file with onnxruntime to find the operators which consume most of the time. The script assumes the first dimension, if left unknown, is the batch dimension.
One ONNX file
This section creates an ONNX graph if there is not one.
import os
import json
from collections import OrderedDict
import numpy
import onnx
import matplotlib.pyplot as plt
from mpl_toolkits.axes_grid1.axes_divider import make_axes_area_auto_adjustable
import pandas
from onnxruntime import InferenceSession, SessionOptions, get_device
from onnxruntime.capi._pybind_state import (  # pylint: disable=E0611
    SessionIOBinding, OrtDevice as C_OrtDevice, OrtValue as C_OrtValue)
from sklearn.neighbors import RadiusNeighborsRegressor
from skl2onnx import to_onnx
from tqdm import tqdm
from mlprodict.testing.experimental_c_impl.experimental_c import code_optimisation
from mlprodict.onnxrt.ops_whole.session import OnnxWholeSession
Available optimisation on this machine.
print(code_optimisation())
Out:
AVX-omp=8
Building the model
filename = "onnx_to_profile.onnx"


if not os.path.exists(filename):
    print("Generate a graph for %r." % filename)
    X = numpy.random.randn(1000, 10).astype(numpy.float64)
    y = X.sum(axis=1).reshape((-1, 1))

    model = RadiusNeighborsRegressor()
    model.fit(X, y)
    onx = to_onnx(model, X, options={'optim': 'cdist'})

    with open(filename, "wb") as f:
        f.write(onx.SerializeToString())
Out:
Generate a graph for 'onnx_to_profile.onnx'.
Functions
We need to generate random inputs to test the graph.
def random_input(typ, shape, batch):
    if typ == 'tensor(double)':
        dtype = numpy.float64
    elif typ == 'tensor(float)':
        dtype = numpy.float32
    else:
        raise NotImplementedError(
            "Unable to guess dtype from %r." % typ)

    if len(shape) <= 1:
        new_shape = shape
    elif shape[0] is None:
        new_shape = tuple([batch] + list(shape[1:]))
    else:
        new_shape = shape
    return numpy.random.randn(*new_shape).astype(dtype)


def random_feed(sess, batch=10):
    """
    Creates a dictionary of random inputs.

    :param batch: dimension to use as batch dimension if unknown
    :return: dictionary
    """
    inputs = sess.get_inputs()
    res = OrderedDict()
    for inp in inputs:
        name = inp.name
        typ = inp.type
        shape = inp.shape
        res[name] = random_input(typ, shape, batch)
    return res
Profiling
Let’s choose the device available on this machine. batch dimension is set to 10.
batch = 10

if get_device().upper() == 'GPU':
    ort_device = C_OrtDevice(
        C_OrtDevice.cuda(), C_OrtDevice.default_memory(), 0)
    provider = 'CUDAExecutionProvider'
else:
    ort_device = C_OrtDevice(
        C_OrtDevice.cpu(), C_OrtDevice.default_memory(), 0)
    provider = 'CPUExecutionProvider'

print("provider = %r" % provider)
Out:
provider = 'CPUExecutionProvider'
We load the graph.
with open(filename, 'rb') as f:
    onx = onnx.load(f)
Create of the session.
so = SessionOptions()
so.enable_profiling = True
so.optimized_model_filepath = os.path.split(filename)[-1] + ".optimized.onnx"
sess = InferenceSession(onx.SerializeToString(), so,
                        providers=[provider])
bind = SessionIOBinding(sess._sess)

print("graph_optimization_level:", so.graph_optimization_level)
Out:
graph_optimization_level: GraphOptimizationLevel.ORT_ENABLE_ALL
Creates random data
feed = random_feed(sess, batch)
moving the data on CPU or GPU
feed_ort_value = OrderedDict(
    (name, (C_OrtValue.ortvalue_from_numpy(v, ort_device), v.dtype))
    for name, v in feed.items())
outputs = [o.name for o in sess.get_outputs()]
A function which calls the API for any device.
def run_with_iobinding(sess, bind, ort_device, feed_ort_value, outputs):
    for name, (value, dtype) in feed_ort_value.items():
        bind.bind_input(name, ort_device, dtype, value.shape(),
                        value.data_ptr())
    for out in outputs:
        bind.bind_output(out, ort_device)
    sess._sess.run_with_iobinding(bind, None)
    ortvalues = bind.get_outputs()
    return [o.numpy() for o in ortvalues]
The profiling.
for i in tqdm(range(0, 10)):
    run_with_iobinding(sess, bind, ort_device, feed_ort_value, outputs)

prof = sess.end_profiling()
with open(prof, "r") as f:
    js = json.load(f)
df = pandas.DataFrame(OnnxWholeSession.process_profiling(js))
df
Out:
  0%|          | 0/10 [00:00<?, ?it/s]
100%|##########| 10/10 [00:00<00:00, 244.07it/s]
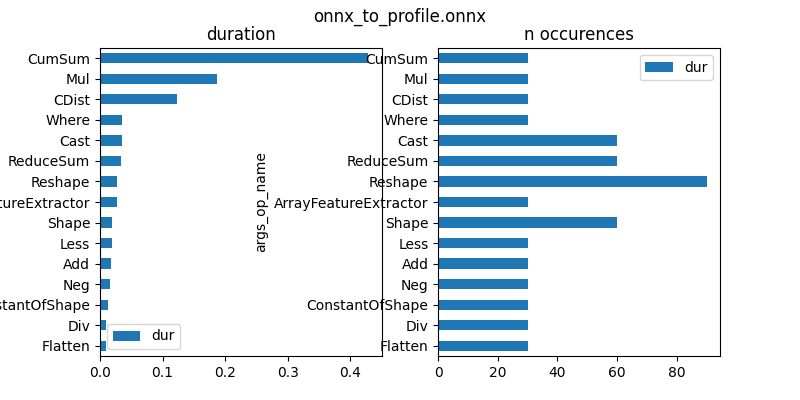
First graph is by operator type.
gr_dur = df[['dur', "args_op_name"]].groupby(
    "args_op_name").sum().sort_values('dur')
total = gr_dur['dur'].sum()
gr_dur /= total
gr_n = df[['dur', "args_op_name"]].groupby(
    "args_op_name").count().sort_values('dur')
gr_n = gr_n.loc[gr_dur.index, :]

fig, ax = plt.subplots(1, 2, figsize=(8, 4))
gr_dur.plot.barh(ax=ax[0])
gr_n.plot.barh(ax=ax[1])
ax[0].set_title("duration")
ax[1].set_title("n occurences")
fig.suptitle(os.path.split(filename)[-1])
Out:
Text(0.5, 0.98, 'onnx_to_profile.onnx')
Second graph is by operator name.
gr_dur = df[['dur', "args_op_name", "name"]].groupby(
    ["args_op_name", "name"]).sum().sort_values('dur')
total = gr_dur['dur'].sum()
gr_dur /= total
if gr_dur.shape[0] > 30:
    gr_dur = gr_dur.tail(n=30)

gr_dur.head(n=5)
And the graph.
_, ax = plt.subplots(1, 1, figsize=(8, gr_dur.shape[0] // 2))
gr_dur.plot.barh(ax=ax)
ax.set_title("duration per node")
for label in (ax.get_xticklabels() + ax.get_yticklabels()):
    label.set_fontsize(7)
make_axes_area_auto_adjustable(ax)
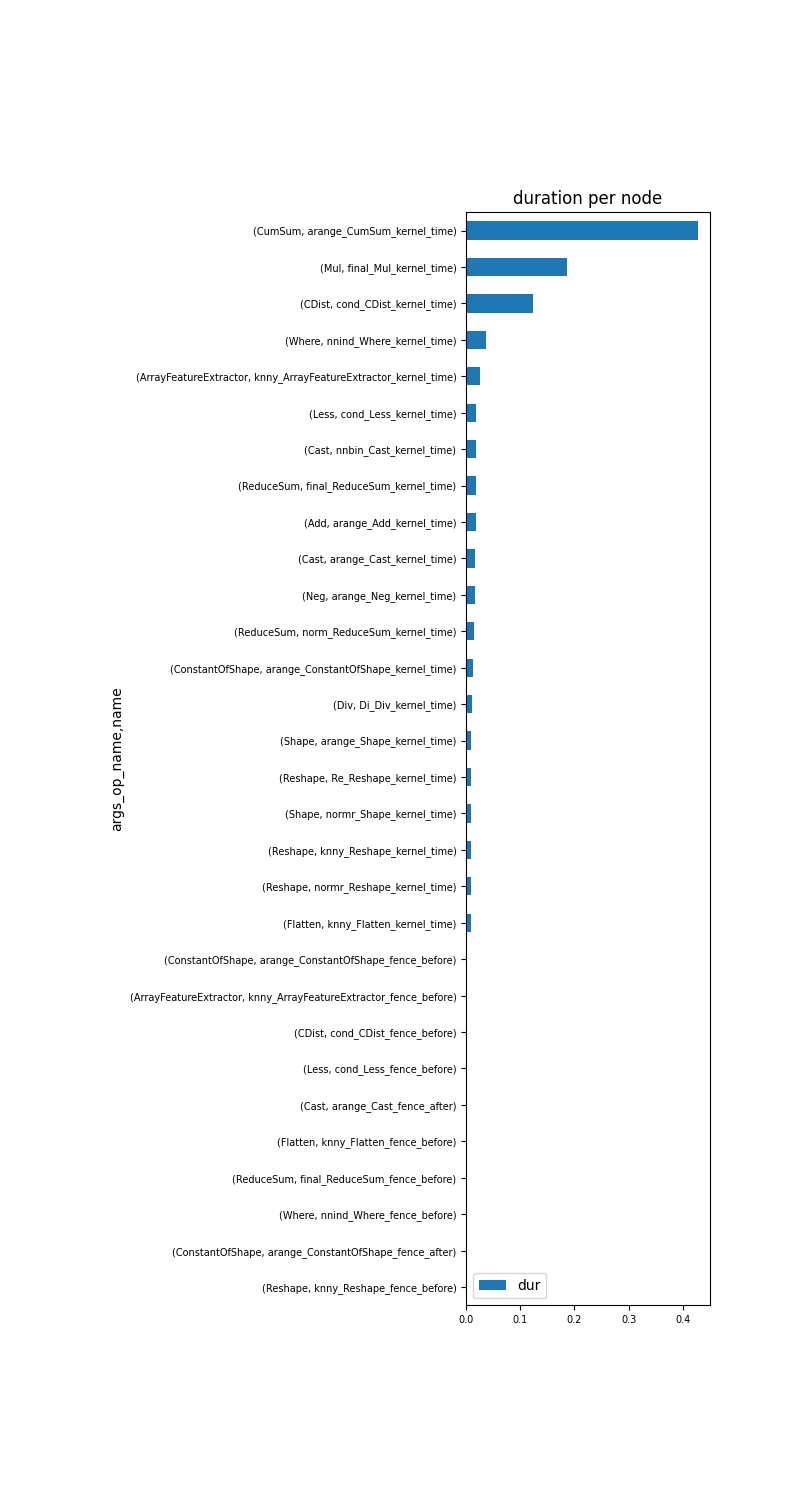
Cumsum is where the execution spends most of its time.
# plt.show()
Total running time of the script: ( 0 minutes 3.529 seconds)