Note
Click here to download the full example code
Profile onnxruntime execution
The following examples converts a model into ONNX and runs it with onnxruntime. This one is then uses to profile the execution by looking the time spent in each operator. This analysis gives some hints on how to optimize the processing time by looking the nodes consuming most of the ressources.
Neareast Neighbours
import json
import numpy
import matplotlib.pyplot as plt
from mpl_toolkits.axes_grid1.axes_divider import make_axes_area_auto_adjustable
import pandas
from onnxruntime import InferenceSession, SessionOptions, get_device
from onnxruntime.capi._pybind_state import (  # pylint: disable=E0611
    SessionIOBinding, OrtDevice as C_OrtDevice, OrtValue as C_OrtValue)
from sklearn.neighbors import RadiusNeighborsRegressor
from skl2onnx import to_onnx
from tqdm import tqdm
from mlprodict.testing.experimental_c_impl.experimental_c import code_optimisation
from mlprodict.plotting.plotting import onnx_simple_text_plot, plot_onnx
from mlprodict.onnxrt.ops_whole.session import OnnxWholeSession
Available optimisation on this machine.
print(code_optimisation())
Out:
AVX-omp=8
Building the model
X = numpy.random.randn(1000, 10).astype(numpy.float64)
y = X.sum(axis=1).reshape((-1, 1))

model = RadiusNeighborsRegressor()
model.fit(X, y)
Out:
RadiusNeighborsRegressor()
Conversion to ONNX
onx = to_onnx(model, X, options={'optim': 'cdist'})

print(onnx_simple_text_plot(onx))
Out:
opset: domain='' version=15
opset: domain='ai.onnx.ml' version=1
opset: domain='com.microsoft' version=1
input: name='X' type=dtype('float64') shape=(0, 10)
init: name='knny_ArrayFeatureExtractorcst' type=dtype('float64') shape=(1000,)
init: name='cond_CDistcst' type=dtype('float64') shape=(10000,)
init: name='cond_Lesscst' type=dtype('float64') shape=(1,) -- array([1.])
init: name='arange_CumSumcst' type=dtype('int64') shape=(1,) -- array([1])
init: name='knny_Reshapecst' type=dtype('int64') shape=(2,) -- array([  -1, 1000])
init: name='Re_Reshapecst' type=dtype('int64') shape=(2,) -- array([-1,  1])
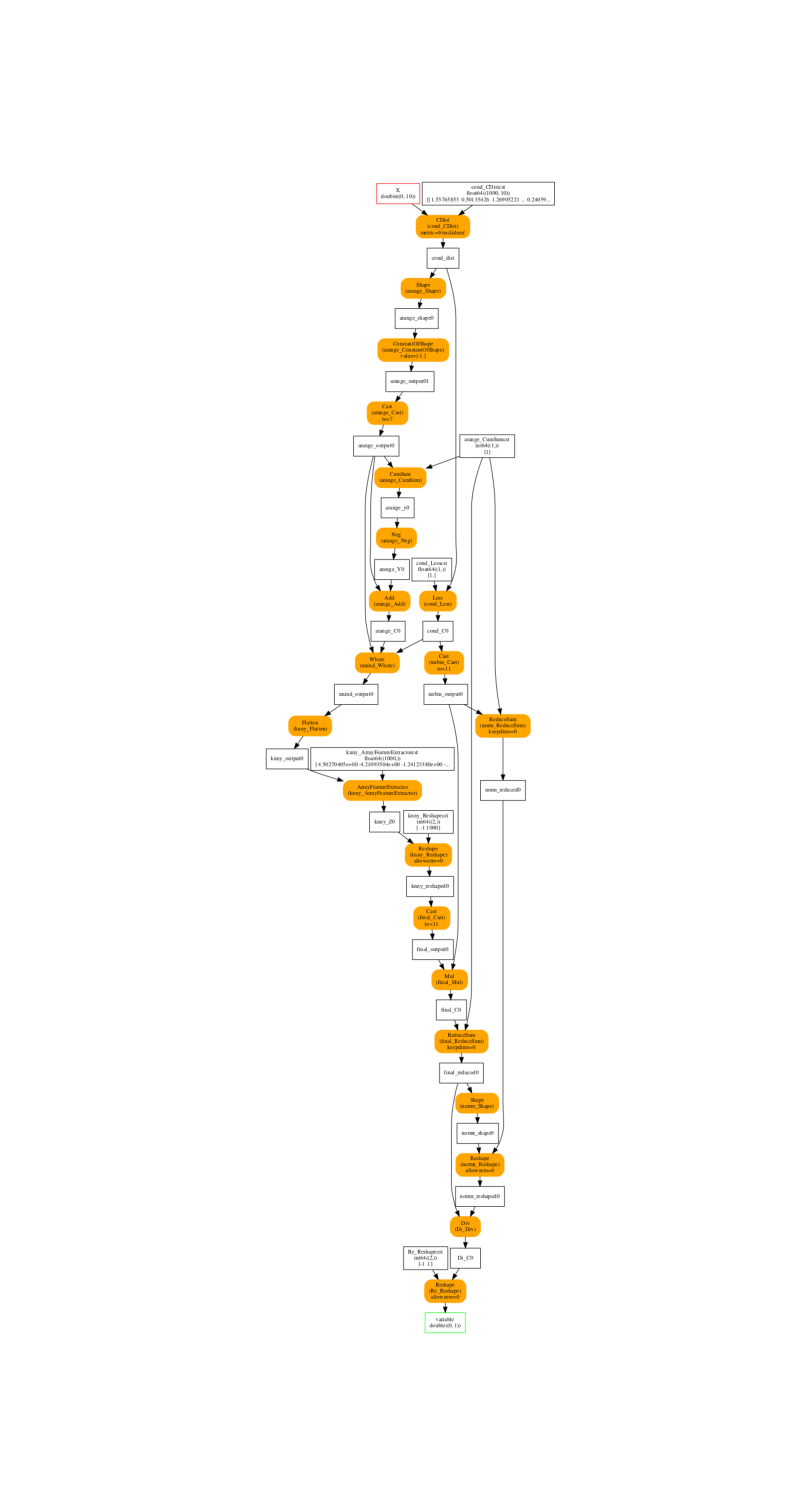
CDist(X, cond_CDistcst) -> cond_dist
  Shape(cond_dist) -> arange_shape0
    ConstantOfShape(arange_shape0) -> arange_output01
      Cast(arange_output01, to=7) -> arange_output0
        CumSum(arange_output0, arange_CumSumcst) -> arange_y0
          Neg(arange_y0) -> arange_Y0
        Add(arange_Y0, arange_output0) -> arange_C0
  Less(cond_dist, cond_Lesscst) -> cond_C0
    Cast(cond_C0, to=11) -> nnbin_output0
      ReduceSum(nnbin_output0, arange_CumSumcst, keepdims=0) -> norm_reduced0
    Where(cond_C0, arange_C0, arange_output0) -> nnind_output0
      Flatten(nnind_output0) -> knny_output0
        ArrayFeatureExtractor(knny_ArrayFeatureExtractorcst, knny_output0) -> knny_Z0
          Reshape(knny_Z0, knny_Reshapecst, allowzero=0) -> knny_reshaped0
            Cast(knny_reshaped0, to=11) -> final_output0
      Mul(final_output0, nnbin_output0) -> final_C0
        ReduceSum(final_C0, arange_CumSumcst, keepdims=0) -> final_reduced0
          Shape(final_reduced0) -> normr_shape0
        Reshape(norm_reduced0, normr_shape0, allowzero=0) -> normr_reshaped0
          Div(final_reduced0, normr_reshaped0) -> Di_C0
            Reshape(Di_C0, Re_Reshapecst, allowzero=0) -> variable
output: name='variable' type=dtype('float64') shape=(0, 1)
The ONNX graph looks like the following.
_, ax = plt.subplots(1, 1, figsize=(8, 15))
plot_onnx(onx, ax=ax)

Out:
<AxesSubplot:>
Profiling
The profiling is enabled by setting attribute enable_profling in SessionOptions. Method end_profiling collects all the results and stores it on disk in JSON format.
so = SessionOptions()
so.enable_profiling = True
sess = InferenceSession(onx.SerializeToString(), so,
                        providers=['CPUExecutionProvider'])
feeds = {'X': X[:100]}

for i in tqdm(range(0, 10)):
    sess.run(None, feeds)

prof = sess.end_profiling()
print(prof)
Out:
  0%|          | 0/10 [00:00<?, ?it/s]
 70%|#######   | 7/10 [00:00<00:00, 65.66it/s]
100%|##########| 10/10 [00:00<00:00, 65.15it/s]
onnxruntime_profile__2022-03-08_02-44-53.json
Better rendering
with open(prof, "r") as f:
    js = json.load(f)
df = pandas.DataFrame(OnnxWholeSession.process_profiling(js))
df
Graphs
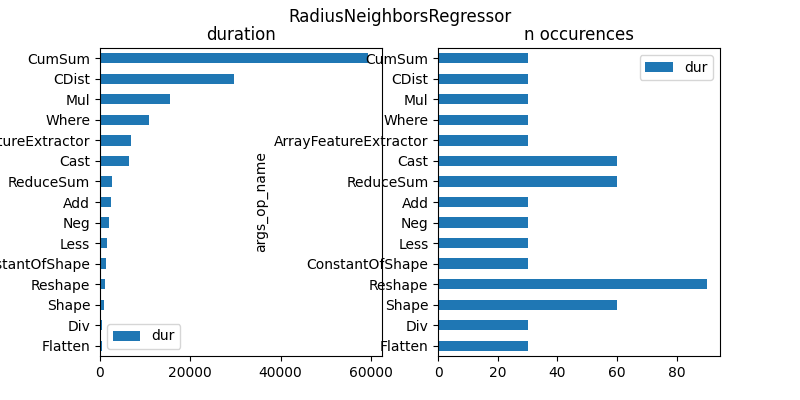
First graph is by operator type.
gr_dur = df[['dur', "args_op_name"]].groupby(
    "args_op_name").sum().sort_values('dur')
gr_n = df[['dur', "args_op_name"]].groupby(
    "args_op_name").count().sort_values('dur')
gr_n = gr_n.loc[gr_dur.index, :]

fig, ax = plt.subplots(1, 2, figsize=(8, 4))
gr_dur.plot.barh(ax=ax[0])
gr_n.plot.barh(ax=ax[1])
ax[0].set_title("duration")
ax[1].set_title("n occurences")
fig.suptitle(model.__class__.__name__)

Out:
Text(0.5, 0.98, 'RadiusNeighborsRegressor')
Second graph is by operator name.
gr_dur = df[['dur', "args_op_name", "name"]].groupby(
    ["args_op_name", "name"]).sum().sort_values('dur')
gr_dur.head(n=5)
And the graph.
_, ax = plt.subplots(1, 1, figsize=(8, gr_dur.shape[0] // 2))
gr_dur.plot.barh(ax=ax)
ax.set_title("duration per node")
for label in (ax.get_xticklabels() + ax.get_yticklabels()):
    label.set_fontsize(7)
make_axes_area_auto_adjustable(ax)

The model spends most of its time in CumSum operator. Operator Shape gets called the highest number of times.
# plt.show()
GPU or CPU
if get_device().upper() == 'GPU':
    ort_device = C_OrtDevice(
        C_OrtDevice.cuda(), C_OrtDevice.default_memory(), 0)
else:
    ort_device = C_OrtDevice(
        C_OrtDevice.cpu(), C_OrtDevice.default_memory(), 0)

# session
sess = InferenceSession(onx.SerializeToString(), so,
                        providers=['CPUExecutionProvider',
                                   'CUDAExecutionProvider'])
bind = SessionIOBinding(sess._sess)

# moving the data on CPU or GPU
ort_value = C_OrtValue.ortvalue_from_numpy(X, ort_device)
Out:
/var/lib/jenkins/workspace/onnxcustom/onnxcustom_UT_39_std/_venv/lib/python3.9/site-packages/onnxruntime/capi/onnxruntime_inference_collection.py:55: UserWarning: Specified provider 'CUDAExecutionProvider' is not in available provider names.Available providers: 'CPUExecutionProvider'
  warnings.warn("Specified provider '{}' is not in available provider names."
A function which calls the API for any device.
def run_with_iobinding(sess, bind, ort_device, ort_value, dtype):
    bind.bind_input('X', ort_device, dtype, ort_value.shape(),
                    ort_value.data_ptr())
    bind.bind_output('variable', ort_device)
    sess._sess.run_with_iobinding(bind, None)
    ortvalues = bind.get_outputs()
    return ortvalues[0].numpy()
The profiling.
for i in tqdm(range(0, 10)):
    run_with_iobinding(sess, bind, ort_device, ort_value, X.dtype)

prof = sess.end_profiling()
with open(prof, "r") as f:
    js = json.load(f)
df = pandas.DataFrame(OnnxWholeSession.process_profiling(js))
df
Out:
  0%|          | 0/10 [00:00<?, ?it/s]
 10%|#         | 1/10 [00:00<00:01,  7.20it/s]
 20%|##        | 2/10 [00:00<00:01,  7.52it/s]
 30%|###       | 3/10 [00:00<00:00,  7.63it/s]
 40%|####      | 4/10 [00:00<00:00,  7.69it/s]
 50%|#####     | 5/10 [00:00<00:00,  7.72it/s]
 60%|######    | 6/10 [00:00<00:00,  7.73it/s]
 70%|#######   | 7/10 [00:00<00:00,  7.74it/s]
 80%|########  | 8/10 [00:01<00:00,  7.75it/s]
 90%|######### | 9/10 [00:01<00:00,  7.76it/s]
100%|##########| 10/10 [00:01<00:00,  7.76it/s]
100%|##########| 10/10 [00:01<00:00,  7.70it/s]
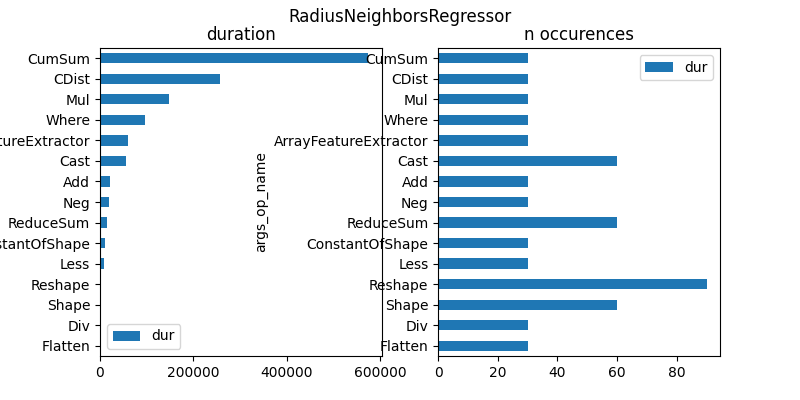
First graph is by operator type.
gr_dur = df[['dur', "args_op_name"]].groupby(
    "args_op_name").sum().sort_values('dur')
gr_n = df[['dur', "args_op_name"]].groupby(
    "args_op_name").count().sort_values('dur')
gr_n = gr_n.loc[gr_dur.index, :]

fig, ax = plt.subplots(1, 2, figsize=(8, 4))
gr_dur.plot.barh(ax=ax[0])
gr_n.plot.barh(ax=ax[1])
ax[0].set_title("duration")
ax[1].set_title("n occurences")
fig.suptitle(model.__class__.__name__)

Out:
Text(0.5, 0.98, 'RadiusNeighborsRegressor')
Second graph is by operator name.
gr_dur = df[['dur', "args_op_name", "name"]].groupby(
    ["args_op_name", "name"]).sum().sort_values('dur')
gr_dur.head(n=5)
And the graph.
_, ax = plt.subplots(1, 1, figsize=(8, gr_dur.shape[0] // 2))
gr_dur.plot.barh(ax=ax)
ax.set_title("duration per node")
for label in (ax.get_xticklabels() + ax.get_yticklabels()):
    label.set_fontsize(7)
make_axes_area_auto_adjustable(ax)

It shows the same results.
# plt.show()
Total running time of the script: ( 0 minutes 24.564 seconds)