Note
Click here to download the full example code
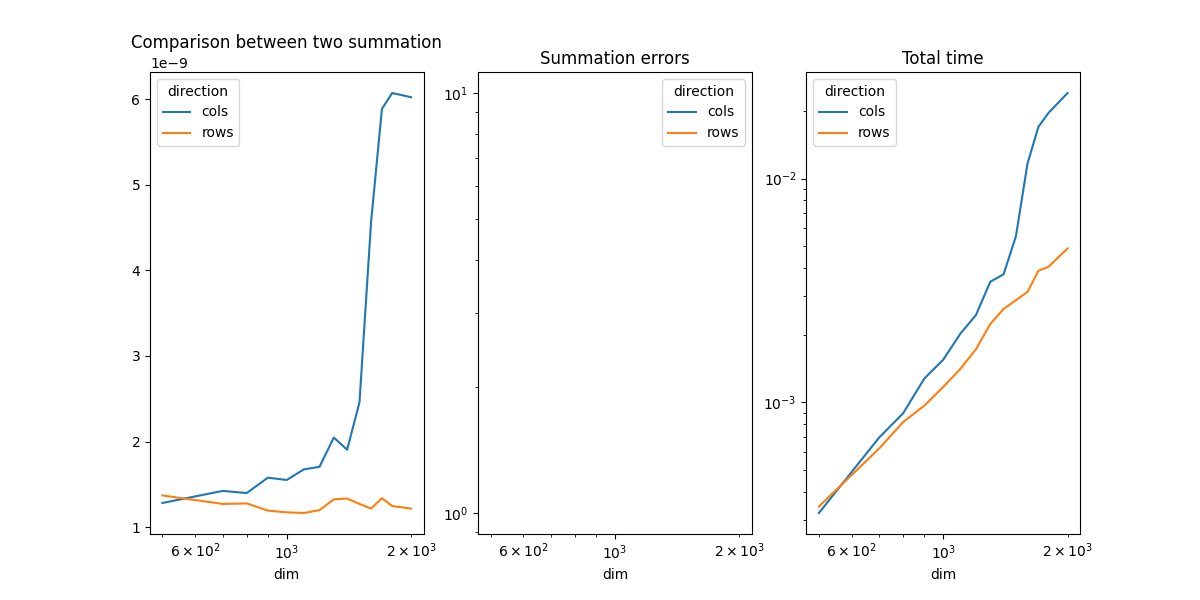
Measuring CPU performance with a vector sum#
The example compares the time spend in computing the sum of all coefficients of a matrix when the function walks through the coefficients by rows or by columns.
Vector Sum#
from tqdm import tqdm
import numpy
import matplotlib.pyplot as plt
from pandas import DataFrame
from onnx_extended.ext_test_case import measure_time, unit_test_going
from onnx_extended.validation.cpu._validation import vector_sum_array as vector_sum

obs = []
dims = [500, 700, 800, 900, 1000, 1100, 1200, 1300, 1400, 1500, 1600, 1700, 1800, 2000]
if unit_test_going():
    dims = dims[:3]
for dim in tqdm(dims):
    values = numpy.ones((dim, dim), dtype=numpy.float32).ravel()
    diff = abs(vector_sum(dim, values, True) - dim**2)

    res = measure_time(lambda: vector_sum(dim, values, True), max_time=0.5)

    obs.append(
        dict(
            dim=dim,
            size=values.size,
            time=res["average"],
            direction="rows",
            time_per_element=res["average"] / dim**2,
            diff=diff,
        )
    )

    diff = abs(vector_sum(dim, values, False) - dim**2)
    res = measure_time(lambda: vector_sum(dim, values, False), max_time=0.5)

    obs.append(
        dict(
            dim=dim,
            size=values.size,
            time=res["average"],
            direction="cols",
            time_per_element=res["average"] / dim**2,
            diff=diff,
        )
    )


df = DataFrame(obs)
piv = df.pivot(index="dim", columns="direction", values="time_per_element")
print(piv)
  0%|          | 0/14 [00:00<?, ?it/s]
  7%|7         | 1/14 [00:01<00:16,  1.26s/it]
 14%|#4        | 2/14 [00:02<00:14,  1.18s/it]
 21%|##1       | 3/14 [00:03<00:13,  1.22s/it]
 29%|##8       | 4/14 [00:04<00:12,  1.20s/it]
 36%|###5      | 5/14 [00:05<00:10,  1.17s/it]
 43%|####2     | 6/14 [00:07<00:09,  1.18s/it]
 50%|#####     | 7/14 [00:08<00:08,  1.16s/it]
 57%|#####7    | 8/14 [00:09<00:07,  1.25s/it]
 64%|######4   | 9/14 [00:10<00:05,  1.19s/it]
 71%|#######1  | 10/14 [00:11<00:04,  1.16s/it]
 79%|#######8  | 11/14 [00:12<00:03,  1.15s/it]
 86%|########5 | 12/14 [00:14<00:02,  1.15s/it]
 93%|#########2| 13/14 [00:15<00:01,  1.18s/it]
100%|##########| 14/14 [00:16<00:00,  1.18s/it]
100%|##########| 14/14 [00:16<00:00,  1.18s/it]
direction          cols          rows
dim
500        1.283317e-09  1.371010e-09
700        1.424335e-09  1.271919e-09
800        1.399220e-09  1.278334e-09
900        1.578634e-09  1.194463e-09
1000       1.551920e-09  1.173616e-09
1100       1.675758e-09  1.166105e-09
1200       1.705026e-09  1.199596e-09
1300       2.047067e-09  1.325730e-09
1400       1.905451e-09  1.334907e-09
1500       2.459402e-09  1.272129e-09
1600       4.564758e-09  1.217785e-09
1700       5.886505e-09  1.339135e-09
1800       6.071599e-09  1.247563e-09
2000       6.022610e-09  1.217832e-09
Plots#
piv_diff = df.pivot(index="dim", columns="direction", values="diff")
piv_time = df.pivot(index="dim", columns="direction", values="time")

fig, ax = plt.subplots(1, 3, figsize=(12, 6))
piv.plot(ax=ax[0], logx=True, title="Comparison between two summation")
piv_diff.plot(ax=ax[1], logx=True, logy=True, title="Summation errors")
piv_time.plot(ax=ax[2], logx=True, logy=True, title="Total time")
fig.savefig("plot_bench_cpu_vector_sum.png")
/home/xadupre/.local/lib/python3.10/site-packages/pandas/plotting/_matplotlib/core.py:744: UserWarning: Data has no positive values, and therefore cannot be log-scaled.
  labels = axis.get_majorticklabels() + axis.get_minorticklabels()
The summation by rows is much faster as expected. That explains why it is usually more efficient to transpose the first matrix before a matrix multiplication.
Total running time of the script: ( 0 minutes 18.305 seconds)